Overview
The DID Usage and Local Presence charts provide valuable insights to optimize your campaign performance and outreach strategy. These tools help you tailor your DID usage by analyzing overuse or underuse of specific numbers and focusing on areas near your business.
Local Presence is location-based proximity matching that ensures your calls are directed to the geographically relevant target audience. It also shows what kind of DID presence you have in certain locations - by area code, city or state, or area code within a city within a state.
Navigating DID Usage and Local Presence
To view DID Usage and Local Presence charts:
- In Readymode iQ, navigate to DID Reputation > DID Usage and Local Presence.
The available DID Usage and Local Presence charts are displayed across two tabs in the right pane:
- DID Usage
- Local Presence
DID Usage
The DID Usage tab is divided into two sections. The first section provides statistics about DID calls, and the second section displays the available DID Usage charts.
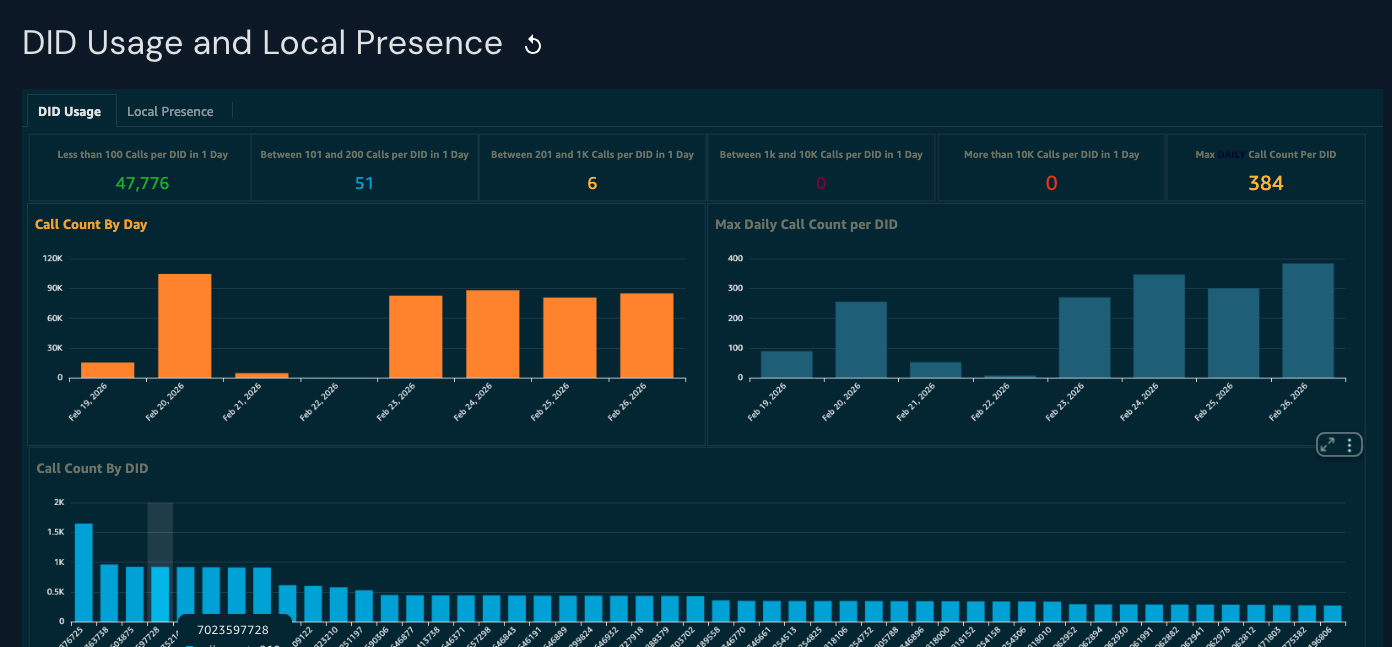
DID Usage statistics
DID Usage statistics allow you to quickly see the maximum number of calls per day from the best-performing DIDs. To view the figures, hover your cursor at the top right of each statistics section and click on the maximize symbol for each statistic.
The available statistics are:
- Less than 100 calls per DID in one day.
- Between 101 and 200 calls per DID in one day.
- Between 201 and 1K calls per DID in one day.
- Between 1K and 10K calls per DID in one day.
- More than 10K calls per DID in one day.
- Max daily calls per DID in one day. See the Max Daily Call Count Per DID chart for more details.
DID Usage Charts
Call Count By Day: View the total number of calls made on specific days.
- Y-axis - Number of calls on a particular day
- X-axis - Specific day
Max Daily Call Count Per DID: View the maximum number of calls made by the highest performing DID on specific days.
- Y-axis - Number of calls on a particular day
- X-axis - Specific day
Call Count By DID: View the total number of calls made over the past seven days.
- Y-axis - Number of calls for a specific ID over the last seven days
- X-axis - Specific DID
Local Presence
Local presence is measured by specific area codes for multiple cities within various states. Not all carriers provide this information. The presence legend on each chart shows you the color for the location type measured and the data for that type displayed - State, City, Area Code, or Other, where the location could not be obtained.
- To view chart options, hover over the top-right corner of a summary or chart and select the menu option.
- To adjust the chart view, select the minimize or maximize icons in the chart options. Click the minimize icon to return to the multi-chart view.
- To highlight data, hover over a bar or section of a bar to view details. This helps you see values within multi-section bars.
- To export data for a single chart, select Export to CSV from the menu, and to view a data summary, select View summary data from the same menu.

Local Presence Charts
Call Count By Day and Local Presence: View the total number of calls in specific locations on specific days.
- Y-axis - Number of calls for a specific location on a specific day.
- X-axis - Specific day
Call Count By Area Code and Local Presence: View the total number of calls for specific area codes over the past seven days.
- Y-axis - Number of calls to a specific area code over the past seven days
- X-axis - Specific three-digit area code
Call Count By Local Presence: View the total number of calls by area, city, or state over the past seven days.
Call Count By State and Local Presence: View the total number of calls by state and local presence over the past seven days.
- Y-axis - Number of calls for a specific state over the past seven days
- X-axis - Specific state
Was this article helpful?
That’s Great!
Thank you for your feedback
Sorry! We couldn't be helpful
Thank you for your feedback
Feedback sent
We appreciate your effort and will try to fix the article